Risk Drivers
Use the Risk Drivers chart to display the key drivers within a risk model.
Acumen Risk uses a metric known as Schedule or Cost Contribution Factor that reports drivers in terms of actual cost and duration rather than abstract relative percentage-based metrics.
The Acumen Risk Drivers chart also differentiates between logic, uncertainty, and risk events when reporting key risk drivers. In addition, it can be configured to report risk drivers at any level of the cost/schedule hierarchy, bringing more meaning to executive risk reporting.
The chart displays duration in days by default; however, you can display duration in hours and vice versa by changing the display settings on the S1 // Projects tab.
Schedule and Cost Contribution (Risk Drivers)
Schedule and Cost Contribution are two risk metrics that report the actual schedule/cost impacts on any given activity (or group) in terms of currency and duration. The Schedule Contribution tornado shows which activities are the biggest risk drivers on the selected activity and, more importantly, it reports in terms of duration.
Risk Event Drivers
In addition to reporting cost and schedule contribution by activity, you can configure the Risk Drivers chart to report the risk events contributing significantly to risk exposure.
Risk Driver Chart Configuration
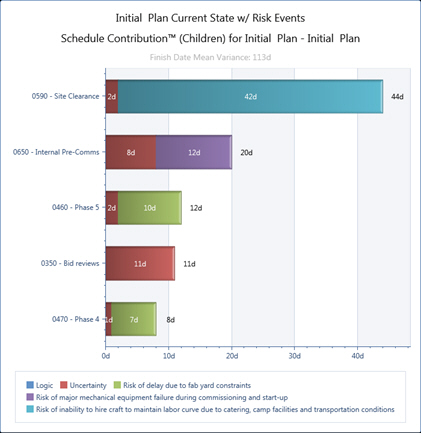
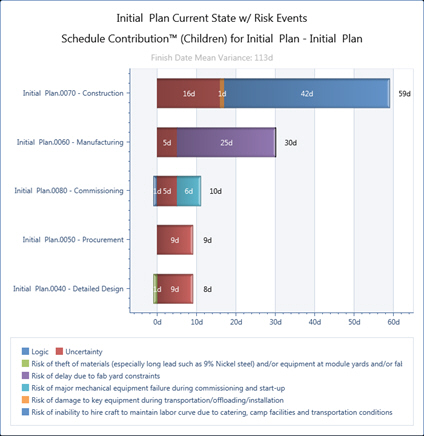
You can configure the Risk Drivers chart to display either summary bars or segmented bars differentiating between logic, uncertainty, and risk events. In detailed mode, you can determine the specific driver behind each activity's contribution to the overall risk exposure profile. In this mode, Acumen Risk reports whether the risk exposure is a result of preceding logic, the uncertainty of the activity itself, or risk events impacting the activity.
Risk Drivers Criticality
Criticality is a traditional risk metric reporting how often an activity (or group of activities) falls on the critical path. Criticality indicates how stable the critical path is as a result of risk and uncertainty. While it is a useful measure of critical path stability, it is not a sound measure for which activities most impact risk exposure. For this, use the Cost/Schedule Contribution Factor.
To view risk driver criticality, select .
Example of a Detailed Risk Driver Chart
Example of a Summarized Risk Driver Chart
The Risk Drivers chart displays duration in days by default; however, you can display the duration in hours and vice versa by changing the display settings on the S1 // Projects tab ().